How to find memory leak in NodeJS application
Memory leaks in NodeJS can occur if code is not written properly. If your application has a memory leaks, the follow the steps to find out memory leaks in NodeJS code.
In the recent months I got a chance to work on a bug which gave me the opportunity to look into memory leaks in NodeJS application. I had to struggle a lot to find out appropriate resources which can help me in debugging the issue of memory leaks in NodeJS code. But, eventually I was able to do so and here I have documented the steps which you too can follow to find memory leaks nodejs.
Before we dig into the steps lets first see what memory leak is. Memory leak is basically code retaining space in memory even after its done executing. As your code continues to leak memory, you will eventually reach a point where your process wont have enough memory to allocate to new variables and your server will crash.
To give you an idea of what a memory leaking code looks like, see the example below.
const globalDataStore = []
const processNumber = num => {
globalDataStore.push(num)
return true
}
setInterval(() => {
processNumber(Math.random() * 1000000)
}, 500)
In the code above, we have a function named processNumber which gets called every 500ms with a random size array as input. In this function we are doing some processing with this array and also storing it in a global array (weird logic).
Since, this random size array is stored in a global array hence it wont get garbage collected. Now, as the number of requests to this function grow, the number of entries in this global array will also grow. This is what memory leak looks like.
As we already have this code example, lets try to debug and find out memory leak in this code.
-
Run your code with --inspect flag. Let’s assume we have saved this code in index.js file, so the complete run command will look like node --inspect index.js.
-
Go to chrome and open the url chrome://inspect.
-
At the bottom you will see a Remote Target section where you will see the above mentioned index.js file. Click on the inspect button.
-
A new Chrome Devtools window will open. Navigate to the memory tab.
-
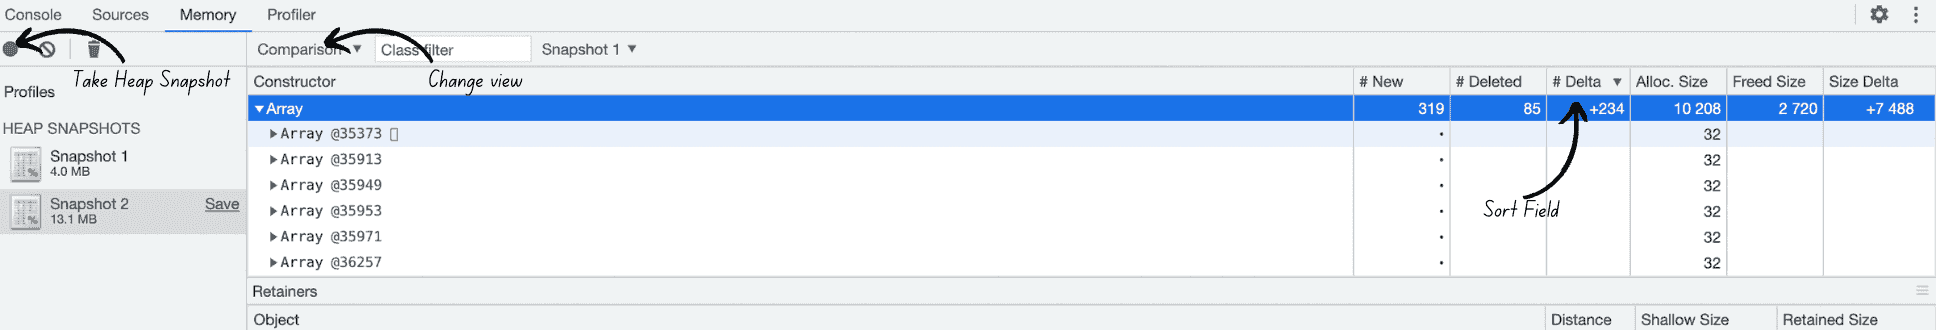
In the memory tab, take a screenshot of current heap memory dump. To do so, click on the Take Heap Screenshot button.
-
Now, wait for sometime and let memory leak for sometime like 2-3 minutes or so.
-
Now, again take a heap screenshot. Once, this done click on the second heap snapshot profile and change the view from summary to comparison. What this comparison view will do is show you how memory allocation has changed in-comparison to the previous one.
-
In this comparison view, you can sort the entires based on delta column to see in which section we have the maximum new memory allocations. You can also sort based on Allocation Size. It will give you a list of maximum memory allocations.

- Now, you will have to manually go though these new memory allocations to find out which piece of code is causing memory leak. You can look though the stack trace of memory allocation and see which code is finally resulting in memory leaks.
So, this was all in this article. If you follow the steps properly you can easily find out which code is causing memory leak in NodeJS code.